
Introduction
Healthcare providers and administrators face increasing pressure to anticipate and manage sudden fluctuations in patient demand. Seasonal surges, pandemics, and unforeseen emergencies can overwhelm existing resources, leading to operational strain and higher costs. This project was developed to support California healthcare organizations with data-driven tools that improve planning and resilience. By applying advanced forecasting models such as ARIMA and XGBoost, we predict hospital bed utilization with greater accuracy. Through interactive Tableau dashboards and geospatial insights, decision-makers gain the clarity needed to allocate resources efficiently, reduce risks, and strengthen preparedness. The result is a scalable framework that empowers healthcare businesses to operate more effectively, ensuring continuity of care while optimizing operational performance.
For More Information
For additional details about this project—including access to the underlying dataset, source code, or collaboration opportunities—please contact us. At SDPV, we are committed to delivering data-driven insights and innovative solutions that create value across industries.
Data & Methodology
Data Source and Validity
For this project, we used the COVID-19 Reported Patient Impact and Hospital Capacity dataset from HealthData.gov, the official platform of the U.S. Department of Health & Human Services (HHS). This dataset contains over 74,000 rows and 15 columns of information, including patient counts, hospital subtypes, bed usage, and location data from 2020–2024. Collected directly from hospitals and managed under the HHS standardized reporting system, the dataset ensures accuracy, timeliness, and reliability. Its most recent update on June 28, 2024 provides a relevant foundation for forecasting healthcare demand and supporting emergency preparedness.
Data Cleaning and Transformation
To ensure robust analysis and clear visualizations, several steps were taken to prepare the California-specific subset of the data:
Filtering for California: Isolating state-level records to focus on regional demand and capacity needs.
Handling Missing Data: Placeholder values (e.g.,
-999999.0) were standardized as NA, with forward and backward filling methods applied to maintain chronological consistency.Column Standardization: Simplified variable names (e.g., total_beds_7_day_avg → total_beds) to improve interpretability.
Date Formatting: Converted string dates into a standard “YYYY-MM-DD” format for accurate time-series analysis.
Aggregation: Grouped data by date and averaged numeric columns to smooth weekly variations and reduce outlier influence.
Validation: Conducted summary statistics and quality checks to confirm data readiness for modeling.
Regional Classification
To enhance clarity in Tableau dashboards, hospitals were grouped into Northern, Central, and Southern California using ZIP code prefixes:
94, 95, 96 → Northern California (NorCal)
93 → Central California
90, 91, 92 → Southern California (SoCal)
This classification, automated with an Excel formula, replaced raw hospital addresses with streamlined regional categories. The result is cleaner, more interpretable dashboards that highlight regional differences in bed resource allocation.
Key Visuals & Findings
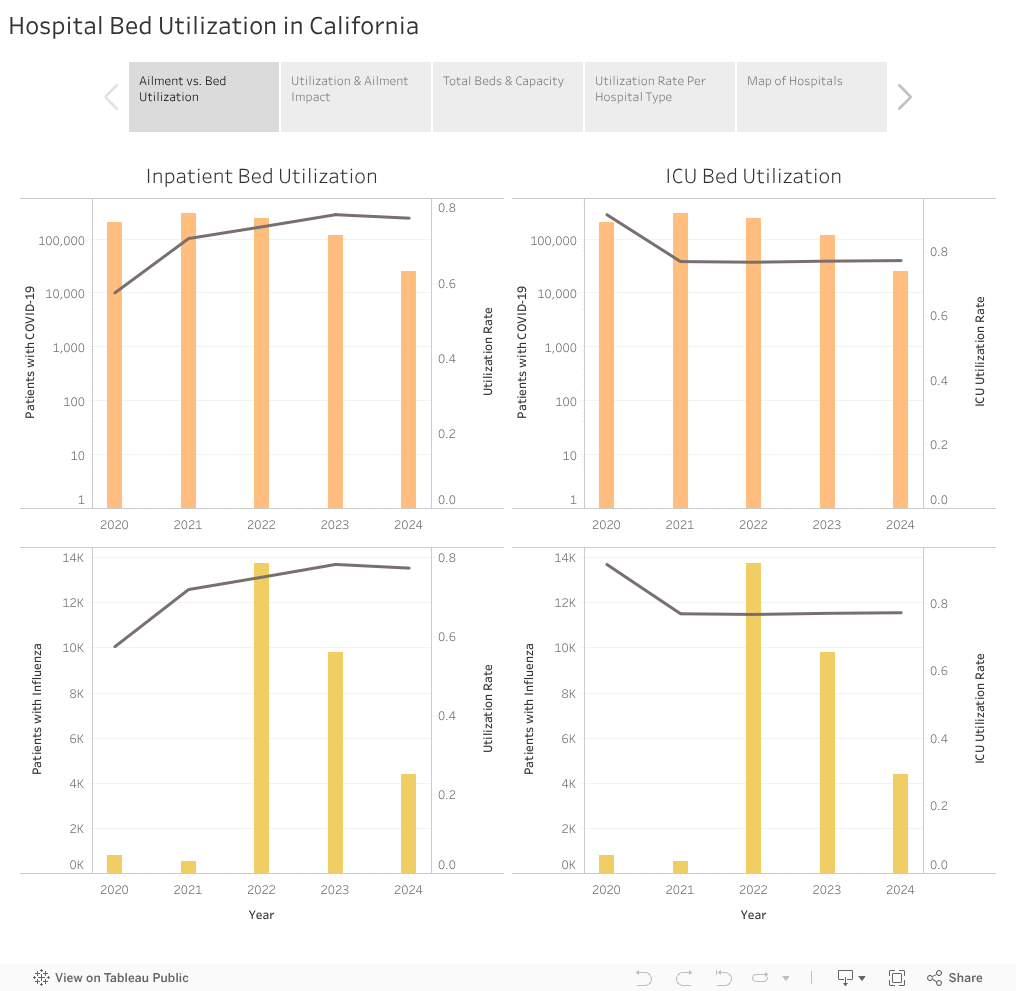
Tableau Insights
1. Ailment vs. Bed Utilization (Dual-axis line chart)
Tracks the relationship between COVID-19 and influenza hospitalizations and bed utilization (2020–2024).
Insight: ICU utilization spiked to 0.91 in 2020 at the start of the pandemic, then stabilized around 0.71. Inpatient beds rose from 0.57 to 0.72 as hospitals shifted strategies, relying less on ICUs as treatments improved.
Takeaway: Bed usage trends reflect how hospitals adapted resource allocation in response to evolving treatment protocols.
2. Bed Utilization & Illness Impact (Map + tables)
An interactive view of California’s hospital bed utilization over time.
Insight: Southern California recorded the highest COVID-19 hospitalizations from 2020–2022, while both Northern and Southern California saw a surge in influenza cases in 2022 and beyond.
Takeaway: Regional variations highlight the importance of tailored planning strategies across California.
3. Total Beds & Capacity (Packed bubbles + scatter + trends)
Examines total vs. used bed capacity across regions.
Insight: Southern California led with ~9.4M total beds, with ~6.7M actively used, while Central California consistently showed the lowest allocation and usage.
Takeaway: Resource disparities emphasize the need for equitable distribution and surge capacity planning.
4. Utilization Rate per Hospital Type (Box-whisker + area chart)
Shows ICU and inpatient usage by hospital type.
Insight: Critical Access Hospitals in Southern California reached the highest ICU utilization (25), while inpatient demand peaked in Short-term and Children’s hospitals across different regions.
Takeaway: Different hospital types carry unique burdens, underscoring the need for flexible allocation frameworks.
5. Map of Hospital Types (Geospatial map)
Displays the distribution of hospital types across California.
Insight: Short-term hospitals cluster in urban centers like Los Angeles, San Francisco, and San Diego, while rural northern/eastern areas rely heavily on Critical Access Hospitals.
Takeaway: Uneven access highlights opportunities for strategic expansion and improved equity in healthcare availability.
RStudio Insights
This section presents a systematic analysis of how California hospitals utilize critical resources, focusing on total beds, ICU beds, and inpatient bed usage. Our primary goal was to forecast future demand for these resources, while our secondary goal was to explore how influenza and COVID-19 trends shape utilization patterns.


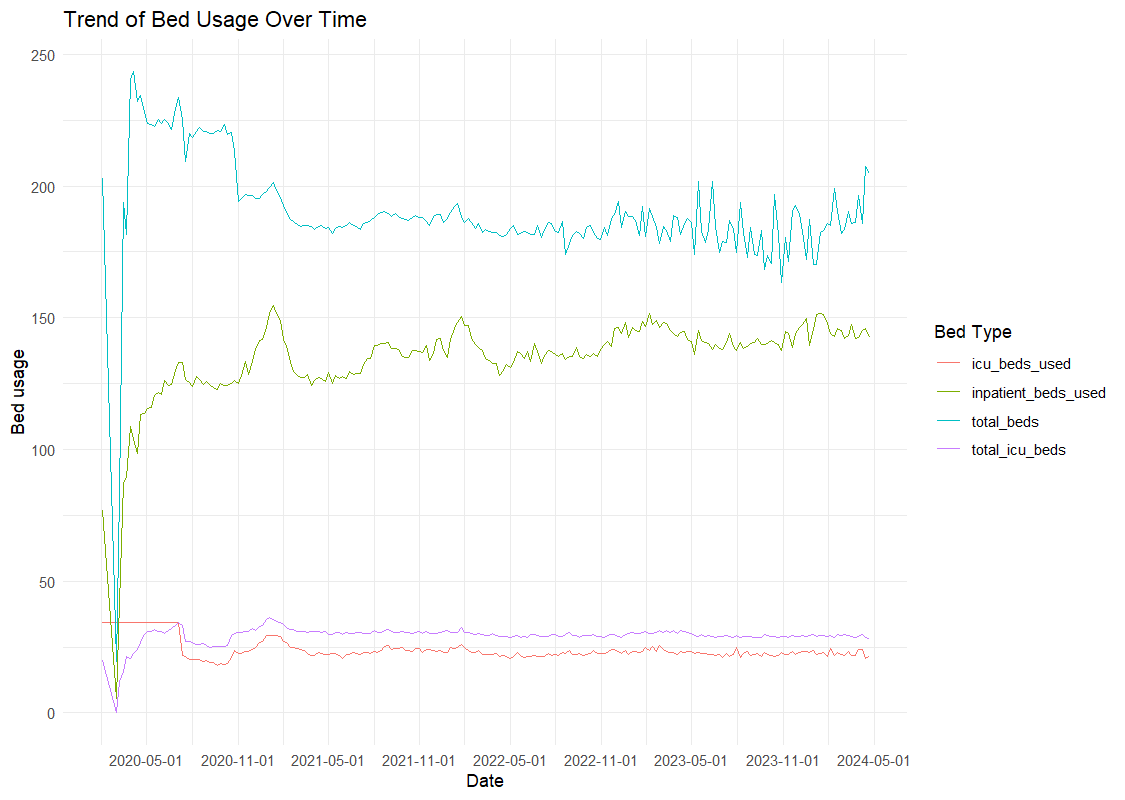

Observed Trends
General Bed Usage: COVID-19 caused a sharp rise in ICU and inpatient usage in 2020, followed by stabilization. Seasonal spikes in inpatient beds align with flu waves, while ICU demand remained consistently high, reflecting the need for critical care.
COVID-19 vs. Influenza: COVID-19 produced the most dramatic surges (Winter 2020–21, Fall 2021), while influenza followed a predictable seasonal pattern. The overlap of both diseases created intense demand, especially in winter months.
Correlation Patterns: ICU usage strongly correlates with COVID-19 hospitalizations, while inpatient usage correlates more with influenza cases. Total beds show broader capacity shifts, including overflow units.
Statistical Insights
On average, inpatient beds (136.4 weekly) were used far more than ICU beds (23.7 weekly), confirming the broader demand for general medical care.
COVID-19 peaks (up to 1,301 patients) far outpaced influenza (≤1 average), highlighting the dominant effect of COVID-19 on capacity.
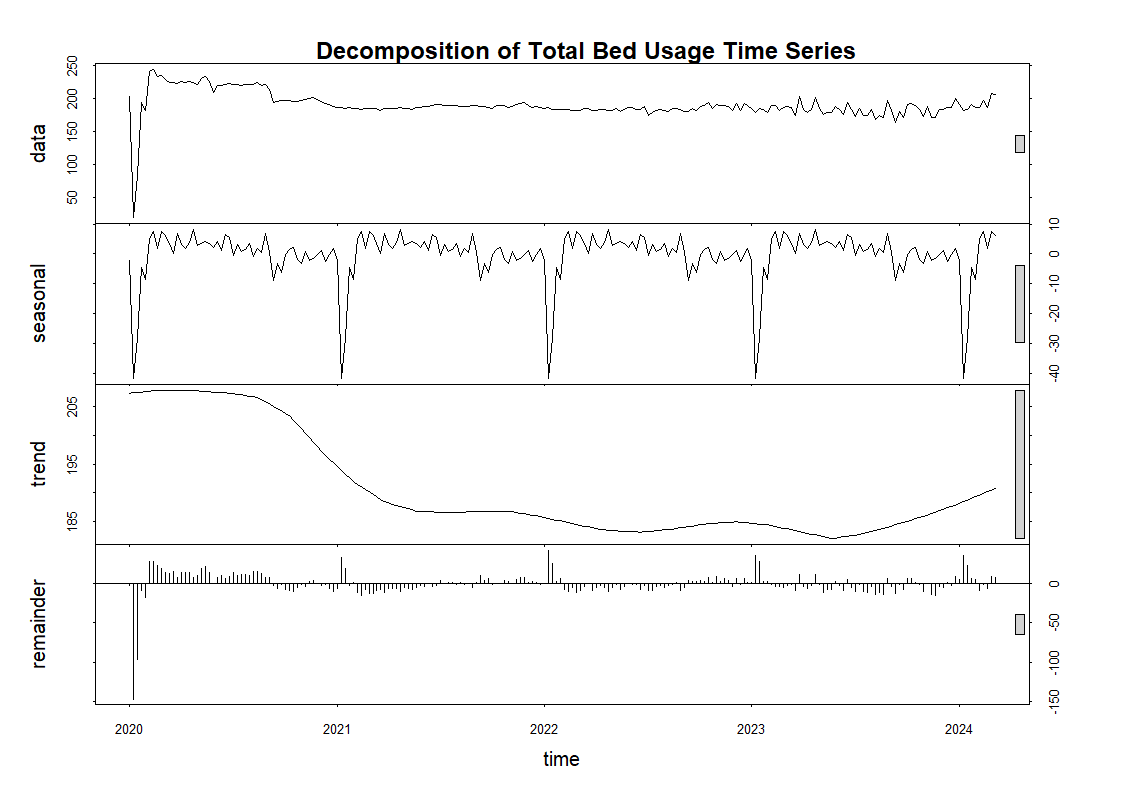
Time-series decomposition shows:
Total Beds: Declined mid-2022, then rebounded upward, with clear seasonal cycles.
Inpatient Beds: Steady upward trend, with dips around holidays.
ICU Beds: Stabilized after 2020, but still show seasonal spikes.
Predictive Modeling
ARIMA Forecasts (24 weeks):
Total Beds → Recurring seasonal surges, requiring flexible allocation.
Inpatient Beds → Stable trend with predictable peaks, useful for planning.
ICU Beds → Consistent baseline demand with minor fluctuations.
XGBoost Forecasts:
COVID-19 counts were the strongest predictor of inpatient bed demand.
Influenza had a smaller but noticeable seasonal impact.
Predictions closely matched historical data, validating model reliability.
Next Steps
Key Insights
COVID-19 shaped ICU demand, influenza shaped inpatient care. Hospitals must plan for both pandemic-scale surges and recurring seasonal spikes.
Regional disparities drive inequities in care. Southern California consistently carried the highest patient loads, while rural regions relied heavily on limited Critical Access Hospitals.
Baseline demand is growing. Even after the pandemic surge, inpatient usage continues trending upward, signaling long-term pressure on resources.
Business Value for California Healthcare Organizations
Proactive Planning: Predictive models (ARIMA, XGBoost) offer a 24-week lookahead, enabling hospitals to anticipate spikes and mobilize resources before shortages occur.
Efficient Allocation: Tableau and ArcGIS dashboards highlight where demand is greatest, allowing administrators to balance resources between high-need regions and underutilized facilities.
Risk Mitigation: Insights help organizations minimize costs from emergency responses, reduce operational strain, and maintain quality of care during surges.
Equity in Access: Regional analysis identifies underserved areas, guiding investment decisions and policy advocacy for better healthcare distribution.